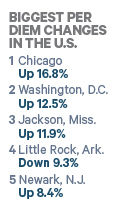
With year-over-year increases in hotel costs outweighing
slight decreases in car rental and dining expenditures, the average per diem
across the 100 U.S. cities in BTN's Corporate Travel Index increased 1 percent
in 2016.
The average per diem was $321.97, compared with $318.80 in
2015. New York City, at a bit more than $549, reclaims its spot as the most
expensive U.S. city for business travel per diems. San Francisco led the list
for the previous three years but dipped to second place for 2016 at $534.03.
Boston is the only other U.S. city to sport a per diem north of $500.

Hotel Costs
The average 2016 cost of a hotel room, including all taxes
and surcharges, was $177.36, up 2.6 percent from 2015 levels. New York was the
most expensive at $385.08, and San Francisco, Boston and Washington, D.C., also
exceeded $300.
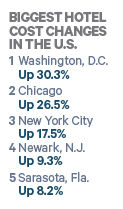
Washington, D.C., in fact, had the largest year-over-year
change, with hotel rates up more than 30 percent. Daily hotel costs in Chicago increased
26.5 percent and New York City increased 17.5 percent.
Bakersfield, Calif., experienced the steepest decline in
daily hotel cost, dropping 5.3 percent to $121.48. A total of U.S. 27 cities
showed at least some decline. Corpus Christie, Texas, and Rochester, N.Y., took
the next biggest hits with rates falling 4.7 percent and 4.4 percent,
respectively.
Three more California cities saw rate drops, as well:
Fresno, Sacramento and San Diego. Advito principal and VP Bob Brindley
attributed the California changes to market rationalization. "There's some
additional capacity. You had, I think, a little bit of an Airbnb impact because
prices were getting very, very high. The demand was still there," Brindley
said of the hotel market in California in 2016, "but the market was just a
little bit less crazy than it was the year before."
The effect of Airbnb is but one of the factors that make
2017 a difficult year to assess for hotel costs. Add to it President Donald
Trump's attempts, unsuccessful thus far, to restrict U.S. visitation from
certain Muslim-majority countries, plus changes in the ratio of hotel rooms to
demand.
As such, Brindley said, rates in corporate-negotiated hotel
programs are up on average from 2016, but not sharply so. "In general,
what we saw overall in the sourcing programs for the 2017 season is that it's
still a supplier-driven market, but it's not quite as much of a supplier-driven
market as the last two years were," Brindley said. "Demand is still
growing; it has a slow trend up. There's been a little bit more additional
capacity in the market, and that's tempered some of the rate increases."
In March, Advito projected U.S. negotiated hotel rates would
increase 3 to 4 percent in 2017. Brindley cautioned that, as hoteliers more
effectively use revenue management to maximize revenue and limit last-room
availability, a comparison of raw corporate hotel rates that companies paid may
not reflect the true state of hotel sourcing.
Car Rental Costs
Car rental suppliers turned up empty-handed in their eternal
quest to raise business rates, as the average daily cost of renting a car in
U.S. Corporate Travel Index cities decreased two-tenths of a percentage point
in 2016 to $48.01. New York led pegged the top rate at $80.25, nearly $20 more
than the next city, Rochester, Minn.
Brindley attributed the flat pricing to competition among
Hertz, Avis Budget and Enterprise, which means 2017 isn't likely to be much
different. "From a corporate perspective, we've seen very, very small
price changes. Any kind of market-price improvement is offset by a slightly
better negotiated rate improvement," Brindley said. "All three of the
big providers are … defending their current share. When a client is going out
to bid, they're aggressively going after that to either maintain or win share."

Dining Costs
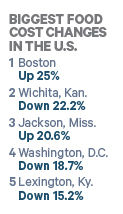
Last year proved difficult for restaurateurs, and that
translated into a 1.2 percent decline in the cost for three meals for a
business traveler in the U.S. The average daily dining expenditure across the
100 U.S. Corporate Travel Index cities was $97.59, down from $98.74 in 2015.
Honolulu, reliant on imports for food, led the way as the most expensive U.S.
city, at $122.89, a few cents ahead of Dallas.
Several analysts have warned of a soft
restaurant market, and the $766 billion in 2016 U.S. restaurant sales fell
short of the $782.7 billion the National Restaurant Association projected at
the beginning of 2016. Still, the association projects 2017 restaurant sales to
increase 4.3 percent year over year and hotel restaurant sales to rise by the
same amount.