Respondent demographics are again at the center of BTN’s Annual Salary Survey results. In the 2017 survey, a significant influx of small and midsize program managers and a larger-than-usual dose of early-career respondents drove average salary numbers down. This year, program demographics move closer to those recorded in 2016, when BTN recorded the highest ever watermark for travel manager salaries. As a result, in the latest survey, average travel manager income jumps back in line with the growth trajectory of the past 15 years.

What Drives Salary
The dramatic shifts shed some light on what factors most influence salary. The two most consistent indicators of travel manager salary levels are travel program size and the travel manager’s job title. To a lesser extent, the number of years an individual has been managing travel correlates with salary level; however, this indicator is most relevant when the travel manager’s career is young. Those managing travel for less than a year report an average salary of $71,500 this year. Respondents who have managed travel for one to three years are much higher, at $98,170, but that’s still considerably below the $115,306 overall average.
Factors beyond years of experience correlate more direct with salary levels. Take job title: A finance director or VP for a relatively small company may take on travel management responsibilities as the company grows. Though it’s only part of the individual’s job description, the salary itself is commensurate with the employee’s title, not how long the employee has managed travel. That’s an important nuance that plays out especially in the small and midmarket, but it also can go the other way. The travel management or “coordination” function is delegated even more often to an executive assistant or travel coordinator, and that drives the travel manager salary downward. In larger programs, too, where travel management requires a team, job titles like coordinator, buyer and analyst may command lower salaries.
BTN’s survey pegs the average salary for a travel coordinator, buyer or analyst at $70,343. Those with travel manager or supervisor job titles, however, command an average annual salary of $104,581. Procurement managers and executives average $121,344, whereas those who’ve graduated to a specialized travel director status bring in an average salary of $150,883. That’s more than the average VP, whose general profile includes managing travel as part of his or her responsibilities for a smaller organization. Dedicated travel directors tend to oversee travel full time for larger programs and often have one or more travel buyers or analysts reporting to them. Presidents, owners, CEOs and others in the C-suite who manage travel are in the same boat as those VPs: Their average $166,589 salary reflects a much broader job description at a smaller organization that spends less on travel.
To drive the point home, check out the chart 2018 Average Salaries by Travel Program’s Annual U.S.-Booked Air Spend below. The travel management function in programs wielding less than $2 million averages a yearly income of $100,982. Moving up the scale, the travel management function in programs spending $2.1 million to $12 million commands an average salary of $109,250. The average salary jumps to $135,350 for programs spending $12.1 million to $20 million a year. It falls in the next bracket to $119,879, perhaps because these programs require a larger staff roster, populated by junior travel managers; this is logical but not something BTN’s survey data can prove or disprove. The biggest programs invest the most in the travel management function; among those companies, the average salary reaches $140,983.

BTN’s survey features fewer early-career travel managers this year: 14 percent have three years of experience or less, compared with 23 percent in 2017. Fewer small and midsize program managers responded to the survey: 62 percent of respondents versus 66 percent last year. The study includes a larger share of senior-level titles; 18 percent of respondents categorize themselves as travel directors, compared with 14 percent last year. In addition, a larger percentage of respondents sit in the $200K Club: 6 percent command salaries at or above $200,000, compared with just 4 percent last year. As always, BTN has disqualified travel agent respondents and removed incomplete surveys and outliers, both high and low, as all those responses would have skewed results.
The Value of Managing Travel
While a 15.6 percent salary jump from last year’s respondents to this year’s respondents provided a great headline opportunity, perhaps the most important statistic in the survey is this: The salaries of this year’s respondents has increased 6 percent over the same group’s 2017 salaries. That’s double the 3 percent average that consulting firm Korn Ferry predicted for all U.S. salaries.
That figure indicates that employers value the travel management function highly. Savings and cost avoidance form employers’ No. 1 performance objectives for travel managers: More than two-thirds of respondents are held to this metric. Beyond that, 42 percent are measured by their contribution of value to the company and 40 percent work to meet year-over-year program improvement statistics.

These performance metrics inform how travel managers prioritize their time. The top three responsibilities for travel managers, according to BTN’s survey, are supplier sourcing, handled by 87 percent of respondents; travel data management, handled by 82 percent; and travel program communications, handled by 75 percent. Sixty-six percent handle travel risk management, an addition to this year’s survey. Climbing the ladder are payment systems, handled by 61 percent, up from 46 percent two years ago, and expense management, handled by 51 percent, up from 34 percent two years ago. Responsibility for meetings management is also on the rise, up 10 percentage points over the past two years. Mobile travel technology management has remained relatively steady over the same period.
Survey respondents indicate that travel managers constantly broaden the scope of their responsibilities to meet their performance goals. Many cite “added responsibilities” in general. A handful note that the broader scope has come with a commensurate pay increase, a promotion or additional headcount to support growing programs. A few say the opposite, such as one respondent who reports, “More responsibility, same pay.” Others are more specific, citing major technology changes like booking and expense tools. Another is excited to “work with all the new technology providers.” Several mention a new focus on meetings.

Asked where they see the most opportunity to advance in their positions, however, nearly a third double down on the traditional travel management role of supplier sourcing and procurement, while 16 percent peg travel data management as the next wave of travel management.
Some respondents say their travel programs have new orientations. “We are becoming more focused on the traveler,” says one, while another says, “Our focus is shifting from savings to traveler comfort and safety.” Several respondents say there’s an opportunity to advance their careers by increasing engagement and outreach efforts, the goal of which is to give each travel programs a “brand” and position it as a benefit to employees. While only a handful say this opportunity represents a major change, a comparison to prior surveys suggests the shift is indeed widespread. This year, 41 percent of respondents say traveler satisfaction metrics are among their performance standards. That’s double the respondents held to that metric just two years ago, making traveler satisfaction the fastest-growing performance metric in BTN’s survey.
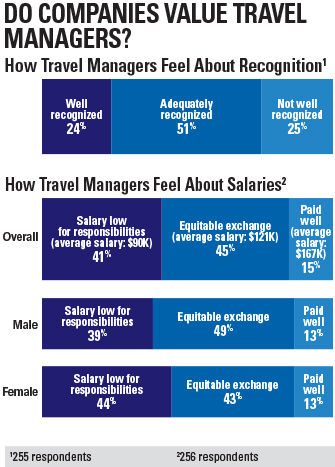
The study shows positive results in terms of how well travel managers are recognized by their organizations for all these efforts. Three-quarters of respondents are either “adequately recognized” or “well recognized” by their employers. Only a quarter are “not well recognized.”
.jpg)
Compensation Satisfaction
When it comes to actual compensation, however, respondent attitudes are not as sunny. Forty-one percent feel their salaries are low for the responsibilities they shoulder. The average salary among those who feel they’re underpaid? $90,000. On the brighter side, 45 percent say their salaries are an equitable exchange for their work. The average salary for those satisfied with their pay: $121,000. Fifteen percent feel their salaries are generous. Average pay among this group: $167,000.
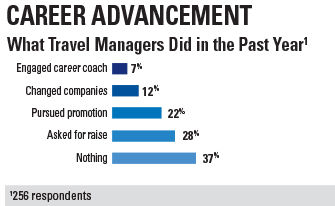
Nearly two-thirds of survey respondents actively pursued more advanced positions and compensation in the past 12 months, and some respondents took a multipronged approach. Twenty-eight percent asked for a raise, and 22 percent pursued a promotion. Twelve percent changed companies, 7 percent engaged a career coach and 14 percent took some other avenue toward career development.

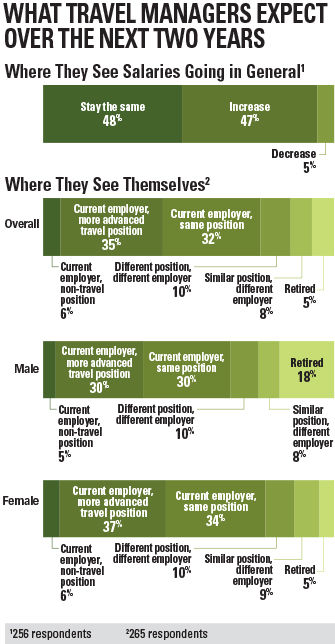
Despite the salary satisfaction slump, just 18 percent see themselves looking for a new employer within two years. Rather, 35 percent see themselves in more advanced travel-related positions in their current companies, while 6 percent expect to stay at their companies but move to positions outside travel management. Thirty-two percent anticipate staying in their current positions with their current employers. Nine percent are headed for retirement.

Asked about the trajectory of travel manager salaries over the next two years, 47 percent expect salaries to rise, while 48 percent expect them to stay the same. Only 5 percent expect travel manager salaries to decline.
Women’s Salaries Trail
Per usual in BTN’s salary survey, female respondents make about 79 cents to every dollar their male counterparts earn. The average salary for female respondents is $106,872, while the average for male respondents is $134,917. Despite the preponderance of women wielding travel management roles—70 percent of survey respondents are women—a closer look at the key salary indicators shows that, overall, female respondents hold their roles in smaller companies and with more junior titles than their male counterparts.
Among respondents with the most junior title, travel buyer/coordinator/analyst, 81 percent are women. The next rung on the title ladder is nearly as lopsided: Among respondents with the travel manager/supervisor title, 80 percent are women. Among procurement managers/executives, who bring in significantly higher salaries, 71 percent are women. Jump to the highly paid travel director level, and only 53 percent are women. Keep in mind that 70 percent of respondents to the survey are women, which means the procurement titles show the expected proportions if all title levels are representative of overall survey demographics.
Same story, different tune for the other best indicator of salary level: travel program size. Programs that spend $2.1 million to $20 million on U.S.-booked air spend show a more robust representation of female travel managers than do larger programs. The largest programs, where travel manager pay is consistently higher, have the highest share of men in travel management ranks.
These dynamics play out as a gap in salary between male and female respondents. Female respondents, however, do report a minutely higher growth rate in their salaries, 6 percent year over year, compared with men’s 5.8 percent.
For anyone, male or female, looking to advance their salaries, the message from BTN’s 2018 salary survey is this: Secure a title change when you ask for that raise at your current company. It’s a commodity that you can take with you wherever you go. For those looking to change companies but remain in a travel management position? Two words: Aim big.